Online Course
NRSG 795: BIOSTATISTICS FOR EVIDENCE-BASED PRACTICE
Module 6: Significance Testing/Hypothesis Testing for 3+ Groups
Analysis of Variance (Anova)
ANOVA is used to test for statistical differences in the mean values for three or more different groups (independent). (click for overview M6.anova basics) The null hypothesis is the population mean of all groups being compared would be equal: Ho: µ1 = µ2 = µ3 = µ4 and the alternative hypothesis is that the Ho is not true-it doesn’t distinguish among the various possibilities of which group maybe different.
Given the similarities to a t test you may be wondering why one doesn’t just use a series of t tests. It gets tedious: if you have 4 groups you would need to do 6 separate t tests. But more importantly the risk of Type I error would increase. The more statistical tests you perform, the more likely it is that some will be significant by chance. Thus do not perform multiple t tests.
Test Assumptions
There are certain assumptions that must be met for the results of a One-Way ANOVA to be valid. These assumptions are:
- The groups being compared have been randomly sampled
- The dependent variable is normally distributed
- The dependent variable is measured on an interval or ratio scale and the independent variable is nominal (or ordinal level with a small number of levels)
- Homogeneity of variance
- The participants in the groups have been independently sampled
F-value and examples M6.anovaterms
In ANOVA, between group variance (differences between groups) is contrasted to within group variance (differences between people in the groups). [click here if you want to see ‘behind the scenes’ of what is going on via hand calculating an ANOVA] Under the null hypothesis between group variation is about the same as within group variation. If groups are different the between group variation tends to be large relative to the within group variance. An F value is calculated and determines if any of the means across the groups are different, similar to how the t-test statistic indicated if there are differences in means of two groups.
F = Between group variability
Within group variability
If group means are equal, there is no between group variability => leads to accepting null hypothesis. When group means are different the differences are attributed to either 1) sampling error or 2) the effect of the independent variable. When the groups are different from one another, between group variation becomes large relative to the within group variation => leading to greater likelihood of rejecting the null hypothesis as the samples do not come from populations with equal means.
Post hoc tests
When there are more than two groups, a significant F test only says that there are differences; post hoc tests are needed to determine which groups have statistically different means (Tukey’s or Scheffé test). You cannot just do multiple t-tests because it increases the risk of Type I error. Post hoc tests are designed for situations in which the researcher has already obtained a significant omnibus F-test with a factor that consists of three or more means and additional exploration of the differences among means is needed to provide specific information on which
means are significantly different from each other (click for examples).
Note: Students performing analyses in Intellectus Statistics can obtain a post hoc test as part of the output. For those using Excel while it can be done in excel it is alittle more complicated so we are not requiring you to calculate it—however, you should mention if one is needed or not.
Effect size
The magnitude of a relationship in the context of an ANOVA uses the eta-squared to describe the effect size. For a 1-way ANOVA the:
eta-square = Sum of squares between
Sum of squares total
The eta square value expressed as a percentage describes x% of the variability in the concept of your study is attributable to the different groups. Cohen (1988) has established some guidelines for values of eta squared: 0.01 small, 0.06 medium, and 0.14 large effect sizes.
Presenting results
This is an example of how results may be written for a One-way ANOVA :
A one-way between-groups ANOVA was conducted to explore the impact of education (high school or less, some college, college degree) on levels of optimism, as measured by the Life Orientation Test. There was a statistically significant difference in at least two of the group means (F=4.6, p=.01). The mean scores of the “high school or less groups” was the lowest (M=21.4, SD=4.6); the means of the “some college group” was higher (M=23.1, SD=4.5). The means of the “college degree” were the highest of the three groups (M=23.4, SD=4.0). Further post hoc analyses would be needed to determine which groups were significantly different from each other.
Note: Similar to what one reports in a t test, include the means and standard deviations of all the groups involved in the ANOVA finding. Include the F statistic and p-value. Normally one would also describe the post hoc findings if a statistical difference was detected. For this course, if you are using excel you need to indicate this and mention if further testing is necessary or not.
Required Readings and Videos
- 1-way ANOVA (start at 4:25) (24:13)
https://www.youtube.com/watch?v=JgMFhKi6f6Y - Performing a 1 Way ANOVA and post hoc test in Excel (14:25)
https://www.youtube.com/watch?v=tPGPV_XPw-o - NOT REQUIRED: article with more information
Learning Activities
- Practice interpreting findings by answering these questions using the table shown below
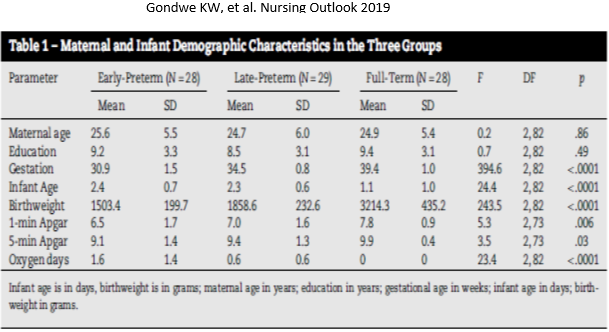
- Check your answers here.
- Practice how to run an ANOVA. The Excel file HeartFailure_n=30.xlsx contains data from a study of 30 patients hospitalized with heart failure who participated in a randomized trial of three treatments: enhanced teaching in hospital, usual care in hospital, and enhanced teaching with home care. You will answer the question: Is there a significant difference in the Heart Failure Self-care Index scores across the three groups? What is your evidence (e.g., F-statistic, p-value)? Is a post hoc test needed?
- Check your answers here.
| Guide for those choosing to use IntellectusStatistics | Guide for those choosing to use Excel |
|---|---|
Refer to the hint sheet and video for how to run an ANOVA |
First watch this video and refer to the hint sheet for how to run ANOVA in Excel Performing a 1 Way ANOVA and post hoc test in Excel (14:25) https://www.youtube.com/watch?v=tPGPV_XPw-o Hints to running ANOVA in EXCEL The ANOVA tab shows the results of sorting the data and creating columns for the three treatment groups so that a 1-Way ANOVA can be calculated. Delete the ANOVA results and run your own analyses comparing the Heart Failure Self-care Index scores for the three groups following the instructions in the Excel video. |
This website is maintained by the University of Maryland School of Nursing (UMSON) Office of Learning Technologies. The UMSON logo and all other contents of this website are the sole property of UMSON and may not be used for any purpose without prior written consent. Links to other websites do not constitute or imply an endorsement of those sites, their content, or their products and services. Please send comments, corrections, and link improvements to nrsonline@umaryland.edu.