Online Course
NRSG 795: BIOSTATISTICS FOR EVIDENCE-BASED PRACTICE
Module 9: Model Building-Multiple Independent Variables
Performing Linear Regression with several independent variables
As with other statistical procedures, the descriptive statistics must be examined before proceeding to performing statistical tests to answer hypotheses/research questions. Analysts must understand their data including the missing values and errors in the data, examining distributions of interval/ratio level variables, and determining if assumptions are met BEFORE proceeding to run a regression. In many statistical programs these procedures are embedded within the statistical procedures and output must be examined in detail before proceeding to interpret statistical tests.
We learned to perform a simple linear regression in Module 7 (simple because it only had one independent variable). Adding in more than one predictor variable now makes it a multiple regression model. A slope estimate is calculated for each independent variable in the model. The outcome variable is predicted from a combination of all the variables multiplied by their coefficients plus a residual term.
![]()
F-ratio statistics is used to test the overall significance of the regression.
t statistics determine the significance of the individual regression coefficients.
Interpreting Output
While the illustration below is using an Excel example, similar values can be found in other software output as well because these are some of the most important aspects to look for and think about.
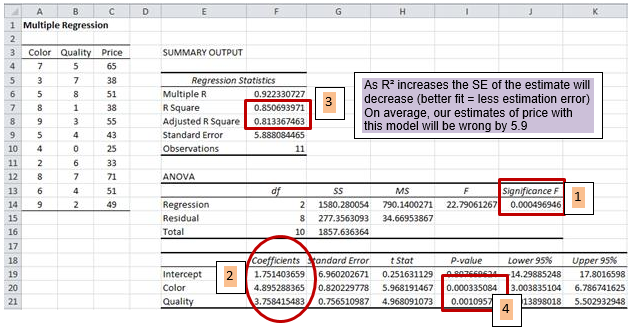
- Since the model p-value for the F-ratio= 0.00497 which is < .05, we reject the null hypothesis.
- This allows us to conclude that the regression model of
Price = 1.75 + 4.90 (Color) + 3.76(Quality) is a good fit for the data. - R square = .85 and adjusted R square=.81 indicate that a good deal of the variability of price is captured by the model.
- We can see that each of the variables contributes to the model. All the coefficients are significant. But what does it mean? Continuous IV such as the quality ranking: For every unit increase in the quality ranking (the x variable) there is an increase (the coefficient is positive) in price (the y variable) of 3.76 (the β estimate) with color being held constant.
How might we write this up? An aim of our research was to identify what aspects of a car might have a relationship (predict) with price. Multiple linear regression analysis revealed that both color intensity and quality positively predicted price, indicating that higher scores on these variables tended to predict a higher priced car. Color intensity was significantly associated with price (t=5.97, p<.001) as was quality (t=4.97, p=.001) even in the presence of each other. The final model was significant (F=22.79, p<.001) and accounted for 81% of the variance in price.
Note: used "adjusted R²" because we have a very small sample.
Want another example? Click here. Note same principals apply regardless of the statistical package used to run the analysis.
Presenting Results
Example of how results may be written for a multiple linear regression:
Multiple regression (OLS) was used to estimate the ability of gender, head circumference and baby’s weight at birth in predicting motor coordination at 2 years of age. Fifteen percent of the variance surrounding motor coordination was explained by gender, head circumference and the birth weight (R2 = 0.154). Overall, the model was statistically significant in predicting motor coordination (F = 3.65, p = 0.031). Weight was not statistically significant in the model (p > 0.05); whereas head circumference was statistically significant (t = 2.68, p = 0.01). For every one cm increase in head circumference, motor coordination scores increased by 0.65 points (beta = 0.65). Males were also found to score higher than females. Males scores were .35 points higher (beta=.35, p=.04).
Note: The description should include the model variance and model significance before going on to describe the finding of the relationship between the independent variables and the outcome. Try to describe the relationship in words that a person who doesn’t understand statistical terms may understand in addition to presenting the beta and p-values.
Required Readings and Videos
- Regardless of what stat program you are using, this video focuses more on interpreting the output-what to look for and what it means: Multiple regression interpretation in Excel (6:32) https://www.youtube.com/watch?v=tlbdkgYz7FM
Learning Activity
- Practice running a multiple regression model using this datafile . Begin by following the steps in hypothesis testing, run the regression model just like you did for module 7 but now add in additional independent variables, then once you have the output do the following: [IS users select linear regression]
- Write the results of the F-test for the multiple linear regression to predict the heart failure self-care [dependent/outcome variable] with two predictors [independent variables] (age and social support) in the model.
- Write the estimated regression equation from the multiple linear regression results.
- What are the R2 value and Adjusted R2 value for the multiple linear regression? What does this mean?
- For each of the estimated regression coefficients in the estimated regression equation, write a sentence of interpretation describing the coefficient estimates.
- Summarize the multiple linear regression analysis results in a format suitable for a journal article.
- Does a 72 year old with a social support score of 50 have better heart failure self-care than an 85 year old with a social support score of 100?
- Check your answers to the learning activity here
This website is maintained by the University of Maryland School of Nursing (UMSON) Office of Learning Technologies. The UMSON logo and all other contents of this website are the sole property of UMSON and may not be used for any purpose without prior written consent. Links to other websites do not constitute or imply an endorsement of those sites, their content, or their products and services. Please send comments, corrections, and link improvements to nrsonline@umaryland.edu.