Online Course
NRSG 795: BIOSTATISTICS FOR EVIDENCE-BASED PRACTICE
Module 9: Model Building-Multiple Independent Variables
Multiple Logistic Regression
In logistic regression the outcome (dependent variable) is dichotomous so assumptions of linear regression models cannot be met. While the regression tables look similar to those seen in linear regression and the statistical approach is similar, the interpretations are different. In Logistic Regression, you examine the odds ratios, which estimates the odds of the outcome relative to the predictor (the odds of an event given one condition versus the odds of the event given by an alternative condition- aka the reference group). We often use the term “likely” and “likelihood” when reporting results of logistic regression. Running logistic models is possible in Excel but we will focus on your ability to interpret rather than perform analyses.
Interpreting output
As with linear regression, the predictor variables can be nominal (dummy variables) or interval/ratio. If the predictor variables are nominal, there must be a referent category that represents the comparator. For example, in linear regression, if the variable FEMALE was a predictor, the coefficient represents the difference in the outcome as compared to males (female=1 and male=0). Examine the table below from a study examining the factors contributing to the likelihood of having a reoperation after breast conserving surgery. The referent categories are indicated as “1” (OR=1) in this table. Since “with insitu disease” is a nominal variable (e.g., insitu=1, no insitu=0), the comparisons that are made are not for a unit change in the predictor as would be seen if age in years was one of the predictors. Rather, the OR is interpreted relative to the reference category. Thus, the unadjusted OR for having Insitu disease (OR=1.91 (95% CI: 1.81 to 2.01) is interpreted as “women with reoperation are 1.91 times more likely to have insitu disease as compared to women without insitu disease” (whose odds ratios is 1 – that is, even odds). The term ‘unadjusted’ means this is the estimate for only the one predictor variable on the outcome, while the term ‘adjusted’ is used to indicate these estimates are from a model that has additional covariates in it- often the others in the table or the authors may make a note of it in a footnote underneath the table. Authors may also word this as holding other variables constant or controlling for other variables.
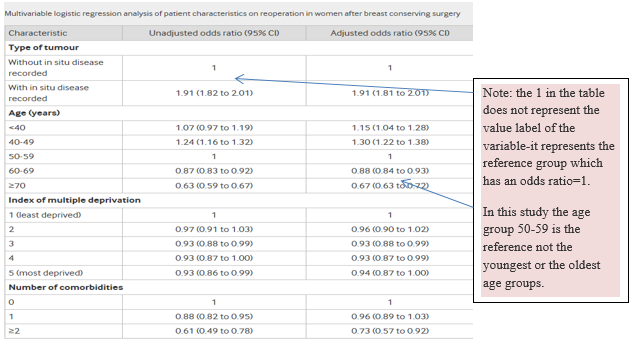
Note a few things about this table:
- Title. The title clearly states the statistical procedure and the outcome being modeled (reoperation vs not having reoperation).
- 2nd Column. The second column lists the “unadjusted” odds ratios (ORs). These ORs reflect the influence of a single predictor and the outcome (simple logistic regression), similar as you have seen when a cross tabulation or pivot table is created.
- 3rd column. The third column lists the “adjusted” ORs. These ORs reflect the influence of the predictor on the outcome with all of the other variables in the model (multiple logistic regression). In the text of the article, you might see the adjusted ORs interpreted as the effect of the predictor on the outcome “while controlling for other variables in the model.”
- Confidence intervals. Confidence intervals around the odds ratios are reported. If the confidence interval includes “1”, then the odds ratio is not significant.
Want more examples? Click here. Note the similarities to linear regression, but at the same time output from a logistic regression model usually also includes exp(ß).
Presenting results
Example of how results may be written for a multiple logistic regression:
Logistic multiple regression was used to estimate the ability of gender, head circumference and baby’s weight at birth in predicting if a 2 year old will pass motor coordination test. Weight was not statistically significant in the model (p > 0.05). A significant association was found between gender and passing the motor coordination test. Males were 50% more likely to pass than females (Odds ratio= 1.50, 95% confidence interval= 1.02, 2.66, p=.01) and every one mm increase in head circumference at birth increased the odds of passing the motor coordination test by almost three fold (Odds ratio= 2.75, 95% confidence interval= 1.56, 3.04, p<.001) , controlling for other variables in the model.
Required readings and video
- https://www.youtube.com/watch?v=zAULhNrnuL4&list=PLIeGtxpvyG-JmBQ9XoFD4rs-b3hkcX7Uu 11:25
- https://www.youtube.com/watch?v=ckkiG-SDuV8&list=PLIeGtxpvyG-JmBQ9XoFD4rs-b3hkcX7Uu&index=2 13:02
LEARNING ACTIVITY:
- Identify an outcome in your own practice area that is likely a nominal variable (e.g., patient fall). Look for a research study that examines that outcome and see if they used logistic regression. You should be able to interpret the text and tables related to the findings.
Here are some example articles if you don’t have the time to do a literature search on your topic. You should be able to interpret the text and tables related to the findings.- Bergquist-Beringer S, Dong L, He J, Dunton N. Pressure ulcers and prevention among acute care hospitals in the United States. Jt Comm J Qual Patient Saf. 2013 Sep;39(9):404-14.
- Abad-Corpa E, Royo-Morales T, Iniesta-Sánchez J, Carrillo-Alcaraz A, Rodríguez-Mondejar JJ, Saez-Soto AR, Vivo-Molina MC. Evaluation of the effectiveness of hospital discharge planning and follow-up in the primary care of patients with chronic obstructive pulmonary disease. J Clin Nurs. 2013 Mar;22(5-6):669-80. doi: 10.1111/j.1365-2702.2012.04155.x
- Calder L, Pozgay A, Riff S, Rothwell D, Youngson E, Mojaverian N, Cwinn A, Forster A. Adverse events in patients with return emergency department visits. BMJ Qual Saf. 2015 Feb;24(2):142-8. doi: 10.1136/bmjqs-2014-003194.
- Complete the Module 9 self-test.
This website is maintained by the University of Maryland School of Nursing (UMSON) Office of Learning Technologies. The UMSON logo and all other contents of this website are the sole property of UMSON and may not be used for any purpose without prior written consent. Links to other websites do not constitute or imply an endorsement of those sites, their content, or their products and services. Please send comments, corrections, and link improvements to nrsonline@umaryland.edu.