Online Course
NRSG 795 – Biostatistics for Evidence-Based Practice
Module 7: Associations of Interval/Ratio Variables
Simple Linear Regression
If two variables are correlated, it is possible to predict the value of one of them based on values of the other. The predictor is the independent variable (X) and the outcome is the dependent variable (Y). The independent variable can be a continuous or a dichotomous variable. For linear regression, the dependent variable must be measured at the interval/ratio level. A regression estimate expresses the predicted relationship not just the correlation (click here for intro to regression).
In simple linear regression, a linear mathematical function (aka the regression equation) quantifies the straight line relationship between two variables. This regression line is the same as the “line of best fit” that can be imposed on a scatterplot. It represents the line which has the smallest deviations between the dots and the line.
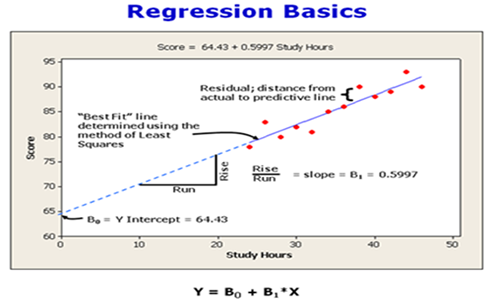
The line can be expressed mathematically by the formula above or as Y = a + bX
- ’a’ is the intercept (where the line crosses the y-axis ) or imaginary or real value of the dependent variable ‘Y’ when X=0 ([Y=b*0 + a] = [Y=a]). Y-intercept: /AKA regression constant also expressed as B0/
- ‘b’ is the slope (measure of the incline or steepness) of the line which is the amount of change in Y for each unit of change of X; if ‘b’ is negative, Y falls for each unit rise in X; if ‘b’ is positive, Y rises for each unit increase in X. /AKA regression coefficient also expressed as B1/ The regression output provides a ‘beta’ estimate that represents the direction and magnitude of the slope.
- Click here if you want more help on the formula and picturing what regression is and here if you want to see ‘behind the scenes’ of what is going on via hand calculating a linear regression
Specifications and Assumptions
Linear regression needs at least 2 variables of metric (ratio or interval) scale. A rule of thumb for the sample size is that regression analysis requires at least 20 cases per independent variable in the analysis.
The most important assumption of the regression model is that its deterministic component is a linear function of the separate predictors; normality and equal variance are typically minor concerns.
- Linearity – check if the scatterplot indicated a straight line relationship
- Multivariate normal- checked the histogram is it roughly normally distributed and is the dependent variable normally distributed for the x variable
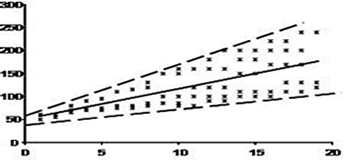
- Equal variance (homoscedasticity) where the variance of the error is constant across observations –check the scatter plot to see if the error terms along the regression are equal. If the data is heteroscedastic the scatter plots looks like the following example:
Note: Assumptions 2 & 3 are a little difficult to evaluate easily in Excel, so if you are using Excel for the course you do not need to calculate them but make sure you mention the assumptions. IS users will find the output does provide some of this information.
Effect size
R2 (Coefficient of Determination) – proportion of shared variability between 2 or more variables. R2 provides a direct means of evaluating the accuracy of the regression equation. Interpretation: “R2 *100%” is percent variance of the outcome y that can be explained by the linear regression model (i.e. indicates how well the linear regression line fits the data)
Presenting results
This is an example of how results may be written for a simple linear regression:
Simple linear regression was conducted to assess the ability of Internal Locus of Control to predict Perceived Stress. Locus of control explained 6% of the variance in perceived stress (R2=.06). The Model was significant (F=13.2, p=.008). For each point increase in locus of control, perceived stress decreased by 2.4 points (beta=-2.4, p=.01).
Note: The description should include the model variance and model significance before going on to describe the finding of the relationship between the independent variable and the outcome. Try to describe the relationship in words that a non statistical person may understand in addition to presenting the beta and p-value.
Required Readings and Videos
Additional information
- Example problems and interpretations
- Article review about correlations and regressions information
Learning Activity
- Complete Self-Test 7
- Practice how to run a simple linear regression. The Excel file HF_SSQ contains data from a study of 30 patients hospitalized with heart failure who participated in a randomized trial of three treatments: enhanced teaching in hospital, usual care in hospital, and enhanced teaching with home care. Answer the following questions
- Is there a relationship between age (the predictor variable) and SSQ (the outcome)?
What is the regression equation for the relationship between age and social support (SSQ)? - Is there a relationship between heart failure self care (the predictor variable) and SSQ (the outcome)?
What is the regression equation for the relationship between self care and social support (SSQ)?
- Is there a relationship between age (the predictor variable) and SSQ (the outcome)?
- Check your answers here
| Guide for those choosing to use IntellectusStatistics | Guide for those choosing to use Excel |
|---|---|
Refer to the hint sheet and video for how to run a linear regression |
Refer to the hint sheet and video for how to run a linear regression in Excel - Hints of how to run a linear regression in EXCEL - Simple regression basics running it in EXCEL (10:08) https://www.youtube.com/watch?v=8JOJ_7R_OWY - Check your worksheet calculations here Note: When you create a scatterplot you can also get a simple linear regression equation by obtaining the trend line information. You should obtain the same results (from a & running a simple regression under the data analysis feature). |
This website is maintained by the University of Maryland School of Nursing (UMSON) Office of Learning Technologies. The UMSON logo and all other contents of this website are the sole property of UMSON and may not be used for any purpose without prior written consent. Links to other websites do not constitute or imply an endorsement of those sites, their content, or their products and services. Please send comments, corrections, and link improvements to nrsonline@umaryland.edu.