Online Course
NRSG 780 - Health Promotion and Population Health
Module 2: Determinants of Health
Assessing Health Status of the Population
The health status of a population is most commonly measured by indicators that reflect disease and mortality, rather than health. Despite the inherent problems with using mortality as a proxy for health, mortality data are often available and used throughout the world to describe the health status of populations. Data on morbidity are not as readily available but are also essential when assessing the health status of a population.
Measures of Mortality
Life expectancy is the average number of years people born in a given year are expected to live based on a set of age-specific death rates. When life expectancy in the U.S. is compared to other nations in the world, we are not at the top, where we expect to be, but trailing behind many other countries for both men and women. During the past two decades life expectancy in the U.S. has fallen to 46th, 78.11 years, as compared to other nations, (Hong Kong ranks first with a life expectancy of 85.29) and is expected to fall further behind in the next several years Click here to see the most recent data from the United Nations Population Division that shows the rankings for 196 countries and the 45 that rank above the US.
The leading causes of death in the U.S. are heart disease, cancer, accidents (unintentional injuries), stroke, and chronic lower respiratory diseases, followed by Alzheimer’s disease, diabetes, kidney disease, chronic liver disease, and suicide. . The vast majority of these are heavily influenced by lifestyle risk factors.

When assessing mortality, it is also important to consider the leading causes of death by age group in the U.S. as noted in the CDC table below.
- From 1 year to the age of 45, unintentional injuries are the leading cause of death.
- From 45 to 65, cancer is the leading cause of death.
- After age 65, heart disease is the leading cause of death.

We can also measure mortality in the U.S. by examining rates the leading causes of death in comparison with peer countries.
From 2020 to 2021 life expectancy continued to decline in the U.S. while rebounding in most comparable countries. From 2021 to 2022 the U.S. life expectancy began to increase and in 2024 life expectancy at birth increased to an all time high, but was still nearly 4 years behind comparable countries.

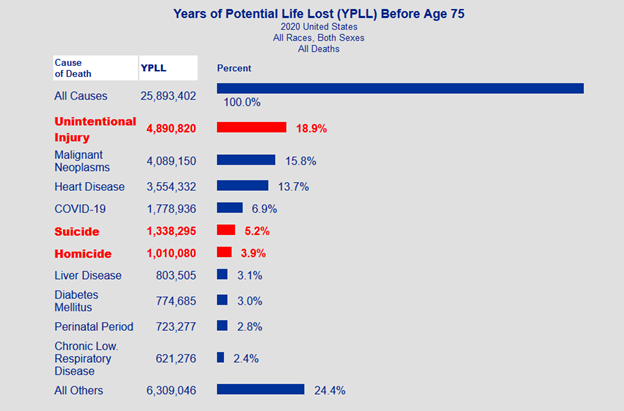
Another way of looking at mortality in the U.S. is to consider the toll of premature mortality on our society. Death before the age of 75 is generally considered premature. Families, work, and the society as a whole lose the valuable contributions of each member who dies prematurely. When we consider premature mortality in relation to the leading causes of death, we see a different profile of the tolls of the leading causes of death.
The top three causes of premature mortality are unintended injury, malignant neoplasms and heart disease.
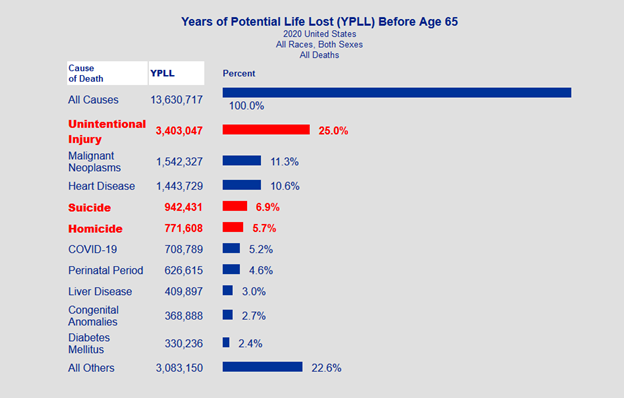
Years of potential life lost (YPLL) is a measure of the years of potential life lost due to premature death. It is an estimate of the average years a person would have lived if he or she had not died prematurely. Here is an example of a 2020 calculation of YPLL before the age of 75 for males & females of ethnic groups in the U.S. Note the differences in years of potential life lost by category if the calculation is based on the age of 65 as shown in the chart below.
Source: https://wisqars.cdc.gov/cgi-bin/broker.exe
Source: https://wisqars.cdc.gov/cgi-bin/broker.exe
For more information on how YPLL is calculated, watch this video. NHANES gathers household and family level information: NHANES includes comprehensive self-reported information on all individuals in the household:
NHANES augments its data with a series of laboratory tests on all individuals in the household which confirm or question much or the self-reported information:
NHANES conducts examinations on all members as well. Using these data, we are able to profile the health status of the nation as a whole. In the 1980s the Behavioral Risk Factor Surveillance System (BRFSS) was piloted by the CDC through state health departments and ultimately expanded to provide unique data for each state. The BRFSS uses telephone surveys which take about a half hour to complete. The BRFSS is conducted on an annual basis. In most states the samples are designed to also provide county specific data. All states gather the same core data including: States can add optional modules that include: BRFSS data can be analyzed by a variety of demographic variables:Measures of Morbidity
National Health and Nutrition Examination Surveys
 To address the limitations of focusing on mortality data and existing utilization databases that only include information on those who access services, in 1956 the National Health Survey Act was passed. This federal legislation authorized a continuing national survey to provide measures of morbidity in terms of current statistical information on the amount, distribution and effects of illness and disability in the U.S. Now called the National Health and Nutrition ExaminationSurveys or NHANES, the U.S. has a continuous stratified sampling system in place to gather the data that provides an overview of the health status of the population. Watch the video, CDC’s former director Dr. Frieden discusses Public Health Data and the NHANES Program for a better understanding of public health data and the role of NHANES.
Acculturation
Medical conditions
Audiometry
Miscellaneous pain
Balance
Physical activity and physical fitness
Blood Pressure
Physical functioning
Cardiovascular Disease
Occupation
Dermatology
Oral health
Diabetes
Osteoporosis
Dietary supplements and prescription medication
Respiratory health and disease
Diet behavior and nutrition
Smoking and tobacco use
Digital symbol substitution exercise
Social support
Early childhood
Tuberculosis
Hospital utilization and access to care
Vision
Immunization
Weight history
Introduction and Verification
Dietary recall
Kidney conditions
Medical conditions
Behavioral Risk Factor Surveillance System
 In the late 1970s and early 1980s, states begin to ask the federal government for data that were specific to their population rather than the nation as a whole. Resources to replicate the NHANES laboratory and examination data would have been prohibitive on a state-by-state basis. However, telephone surveys were beginning to show the capacity to gain the requested data in a cost-effective format.
Diabetes
Injury Control
Sexual Behavior
Alcohol Consumption
Family Planning
Cardiovascular Disease
Health Care Coverage and Utilization
Arthritis
Health Care Satisfaction
Quality of Life and Caregiving
Oral health
Folic Acid
Hypertension Awareness
Skin Cancer
Cholesterol Awareness
Tobacco Use Prevention
Immunization
Smokeless Tobacco
Exercise:
This website is maintained by the University of Maryland School of Nursing (UMSON) Office of Learning Technologies. The UMSON logo and all other contents of this website are the sole property of UMSON and may not be used for any purpose without prior written consent. Links to other websites do not constitute or imply an endorsement of those sites, their content, or their products and services. Please send comments, corrections, and link improvements to nrsonline@umaryland.edu.