Online Course
NRSG 795: BIOSTATISTICS FOR EVIDENCE-BASED PRACTICE
Module 4: Inferential Statistics
Type I and Type II Errors
When you make a conclusion about whether an effect is statistically significant, you can be wrong in two ways:
- You've made a type I error when there really is no difference (association, correlation..) overall, but random sampling caused your data to show a statistically significant difference (association, correlation...). Your conclusion that the two groups are really different (associated, correlated) is incorrect. Type I errors are equivalent to false positives as you are rejecting a null hypothesis when it is really true.
- You've made a type II error when there really is a difference (association, correlation) overall, but random sampling caused your data to not show a statistically significant difference. So your conclusion that the two groups are not really different is incorrect.

Researchers can control the probability of committing an error. The level of significance (alpha, α) can control Type I errors. The most widely used standard for the level of significance is 0.05 which corresponds to the 95% confidence interval. With a .05 significance level, we accept a risk that out of 100 samples we will reject a true null five times or conversely the probability that a true null is accepted is .95(1-α). With a 0.01 significance level the risk of a Type I error is less likely (reject the null in only 1 out of 100 samples). Controlling Type II errors is more complex as it is affected by many factors, such as sample size, measurement quality, and the strength of the relationship. The probability of committing a Type II error is symbolized as β (beta). The probability to correctly reject the null when it is full is referred to as the power of the statistical test (1-β).
The probability of making a Type II error increases as the risk of making a Type I error decreases.
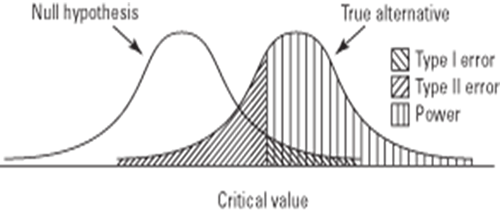
In order to graphically depict a Type II error, imagine next to the distribution for the null hypothesis a second distribution for the true alternative. If the alternative hypothesis is actually true, but you fail to reject the null hypothesis for all values of the test statistic falling to the left of the critical value, then the area of the curve of the alternative (true) hypothesis lying to the left of the critical value represents the percentage of times that you will have made a Type II error.

Required Readings and Videos
- View this video https://www.youtube.com/watch?v=FHT6e_mdGoU (4:24)
This website is maintained by the University of Maryland School of Nursing (UMSON) Office of Learning Technologies. The UMSON logo and all other contents of this website are the sole property of UMSON and may not be used for any purpose without prior written consent. Links to other websites do not constitute or imply an endorsement of those sites, their content, or their products and services. Please send comments, corrections, and link improvements to nrsonline@umaryland.edu.