Online Course
NRSG 795: BIOSTATISTICS FOR EVIDENCE-BASED PRACTICE
Module 11: Testing Differences Over Time
Common Parametric and Nonparametric Procedures for Testing Changes over Time
Some of the common statistical approaches you already learned can be used to statistically test whether there has been a significant change over time. In many trend studies, the outcome is interval level – a rate, a mean, or a proportion. The predictor is a time period (e.g., week, month, quarter), so it is also considered an interval level measure. Assuming that you meet the assumptions of the test, linear regression can be used with time as the independent variable and the outcome as the dependent variable. If you have ordinal data or do not meet the assumptions for linear regression, you may consider a special case of the Chi Square Test – the Mantel Test for Trend.
Linear Regression to Measure Trends
Linear regression can be used to assess for a significant trend. Lets use an example- In your clinic it was noted that only a low number of patients were obtaining a flu shot. In order to get a flu shot one needs to be offered the opportunity to get it. Changes to the clinic processes were implemented with a goal to improve their performance. A goal was set that every patient appropriate to receive a flu shot is offered a flu shot.
Data was collected every day for four weeks. The dataset was set up as: 1) each row represents one of the days and 2) the column variables include the number of flu shots offered and the total patients appropriate to receive a flu shot that day. Then in another column, a proportion can be calculated (number flu shots/total patients) to represent the percentage of patients offered a flu shot for each day. Assuming model assumptions are met, linear regression can be used with time (day) as the independent variable and the outcome (percentage of patients offered a flu shot) as the dependent variable.
In the regression, the time period (e.g., Day 1, Day 2, Day 3 =1,2,3…) is the predictor and the outcome is the % of patients offered flu shots. You are essentially testing whether the slope of the line of best fit is significantly different from 0 (a slope close to 0 would indicate no-little change, where as increasing slope values indicate a change). Using a fictitious dataset, the following scatterplot was created to illustrate how the number of patients offered flu shots varies by time. The line of best fit – the slope - has been added. The slope of the line is not flat thus it is indicating that over time the number of patients offered flu shots changed.
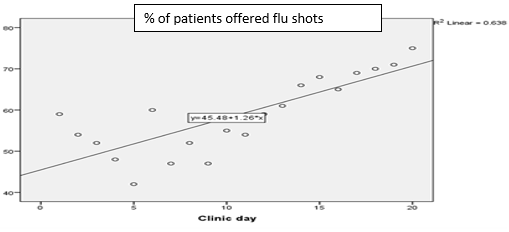
But is the change significant? In this example, the t-value for the regression coefficientprovided in the table below indicates that there is a significant increase in the slope of the line (t=5.63, p<.001). In fact, for every increase of a day, the mean percentage of patients offered flu shots goes up by 1.259. Between the graph and the information provided in the table we can say there was a significant increase in the number of patients being offered a flu shot, but also note more work needs to be done because the clinic has not reached it’s goal. The percentage has not reached 100%.

As you continue to build your statistics tool box, you will see that having a grasp of the common statistics procedures will help you evaluate what approaches can be used to answer a research question. There is rarely only one. For example, chi square tests can be used to determine if proportions change over time.
Chi Square Test to Measure Trends
The emergency department at General Hospital A receives about 1000 transfers from outside hospitals each year. The transferred patients come from numerous hospitals and all hospitals record their radiology results with different software, not all of which can be viewed by the radiologists at General Hospital A. This situation results in the need for repeat radiological tests. The radiology department at General Hospital A decided to implement a new tool, called ViewSmart (fictional name). ViewSmart allows the radiologist at General Hospital A to view the radiological images from other facilities. After implementation, the radiologists want to determine if they have significantly reduced the number of repeat radiological procedures conducted on transferred patients. Using 6 months of data (July to December 2012) prior to the implementation of ViewSmart, and 6 months of data (July to December 2013) after implementation of ViewSmart, the radiologist uses Chi-Square analysis to determine if there was a significant decrease in patients who received repeat radiological tests at the time of transfer.
Prior to ViewSmart, 299/486 patients (62%) received repeat radiology tests at the time of transfer. After the implementation of ViewSmart, 228/489 patients (47%) received repeat radiology tests at the time of transfer. Below is the Cross-tabulation table, including the observed and expected values. Using Chi-Square analysis, the radiologist determines that this was a statistically significant decrease χ2 (1,N=975) = 21.78, p <.001.

Learning Activity
The radiologist could also use the Z-test of proportions to determine if the patients transferred to General Hospital A after the implementation of ViewSmart received fewer repeat radiology tests than the patients who were transferred prior to the implementation of ViewSmart. The Z-test also tests the hypothesis that there is a difference between the proportion of successes (or failures) in two samples.
Using the Z-test for proportions, and the Z-test calculator for two proportions on the following website, https://www.socscistatistics.com/tests/ztest/default.aspx read about the z-test. This is based on the z-distribution that you learned about earlier in the semester. Can you help the radiologist calculate the Z-score using the calculator? (Compare the proportion with repeat test at time 1 to proportion with repeat test at time 2). Can the radiologist conclude that patients transferred to General Hospital A after the implementation of ViewSmart undergo significantly fewer repeat radiology tests?
Answer:
Z=4.667, p <.05; Yes, the radiologist can reject the null hypothesis and conclude that patients transferred to General Hospital A after the implementation of ViewSmart undergo significantly fewer repeat radiology tests.
This website is maintained by the University of Maryland School of Nursing (UMSON) Office of Learning Technologies. The UMSON logo and all other contents of this website are the sole property of UMSON and may not be used for any purpose without prior written consent. Links to other websites do not constitute or imply an endorsement of those sites, their content, or their products and services. Please send comments, corrections, and link improvements to nrsonline@umaryland.edu.