Online Course
NRSG 795: BIOSTATISTICS FOR EVIDENCE-BASED PRACTICE
Module 10: Other Common Uses of Statistics and the Need for Good Data
Sensitivity and Specificity
Screening programs or tests are very important for primary prevention. In addition to reliability and validity, you will also hear the use of sensitivity and specificity as additional measures of validity. These are measures of how well the test correctly detects people with the disease and eliminates those without the disease.
Sensitivity and specificity are both measures of a test’s validity – its ability to correctly detect people with or without the disease in question.
Sensitivity of a test is its ability to detect people who do have the disease. It is the percentage of the people with a disease that is correctly detected or classified.
The specificity of a test is its ability to detect people who do not have the disease. It is the percentage of disease-free people who are correctly classified or detected.
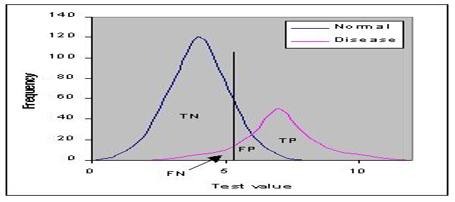
Ideally a test would perfectly discriminate between those who had the disease vs those without. However, in humans the distribution of test results usually overlap, sometimes widely. One then has to decide where to put the cut-off that defines normal versus abnormal which determines the sensitivity and specificity. Where the cut-off should be placed depends on the implications of the test. If the cost of missing a case is high and there is effective treatment then you focus more on the sensitivity rather than specificity.
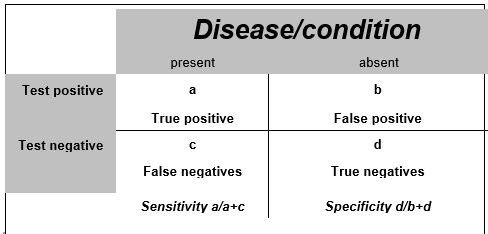
Commonly, a 2x2 table is used to illustrate these relationships. Calculations are straightforward and you should be able to calculate sensitivity and specificity (click here for additional information related to screening for disease and example calculation).
Diagnostic test performance
Sensitivity or specificity alone cannot be used to measure the performance of a test. In diagnostic tests the positive and negative predictive values are calculated and they allow you to clinically say how likely it is a patient has a specific disease. High values reflect the accuracy of the test.
- – Positive predictive value (PPV), also called the precision, is the probability that following a positive test result, that individual will truly have that specific disease. PPV=TP/(TP+FP)
- – Negative predictive value (NPV) is the probability that given that the test is negative the subject does not have the condition tested for. NPV=TN/(TN+FN)
Both the PPV and NPV are influenced by the prevalence (frequency) of the condition. The figures below illustrate how the performance of a test can change depending on the prevalence. The test sensitivity (95%) and specificity (80%) are exactly the same in both of the figures, but notice the PPV-probability that you detect someone with the condition is much lower in the left hand figure where the prevalence is low as compared to a higher PPV in the figure on the right where the prevalence is higher in the population.
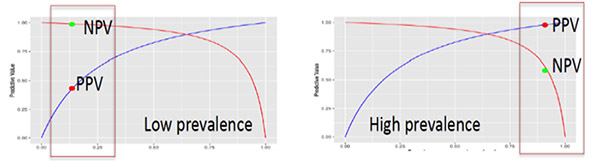
In other words, for any given test (i.e. sensitivity and specificity remain the same) as prevalence decreases, the PPV decreases because there will be more false positives for every true positive. This is because you’re hunting for a “needle in a haystack” and likely to find lots of other things that look similar along the way – the bigger the haystack, the more frequently you mistake things for a needle. Therefore, as prevalence decreases, the NPV increases because there will be more true negatives for every false negative. This is because a false negative would mean that a person actually has the disease, which is unlikely because the disease is rare (low prevalence).
Interpreting sensitivity and specificity in screening tests
If we know the parameters of a screening test we are able to interpret it in the form of how many people will be misdiagnosed (missed or falsely detected). Lets take mammography, a screening test for breast cancer as an example. The sensitivity ranges from 75% to 90% depending on the age and family history of the person being screened. It also has a high specificity of 90-95%. This tells us that 10-25% of those being screened will be missed (given a false-negative result) and 5-10% will be a false positive result that are asked to come back for a diagnostic test.
Screening exams have come under particular scrutiny in evaluating their cost and benefit for the general population. Thus, there has been an increasing emphasis on measures focus on the number of people that need to be treated to achieve a good outcome, hence the name number need to treat (NNT). The NNT is an index of interest in the current evidence-based practice environment. The index is especially useful for intervention as it represents an estimate of the number of people needed to receive a treatment to prevent one undesirable outcome.
NNT= 1 divided by the absolute risk reduction
Of course, these calculations do not take into account that some subpopulations may get more benefit – and there may be harms that increase the risk. These are the complicated questions that NIH consensus conferences often deal with when it comes to recommending screening.
Required Readings and Videos
- Sensitivity & Specificity (8:12)
http://www.youtube.com/watch?v=Zsw2J29DV0s - Review Bonita, Beaglehole, and Kjellstrom pp. 112
http://whqlibdoc.who.int/publications/2006/9241547073_eng.pdf - How to calculate number needed to treat (3:48)
http://www.youtube.com/watch?v=M16SqIMqVto - Number needed to treat (6:15)
http://www.youtube.com/watch?v=eHxaDQNyfV4 - Sample size calculator
Learning Activity
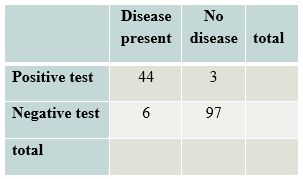
- Based on the following data what is the sensitivity and specificity of this test? Check your answers here.
- Review this video that relates how sensitivity and specificity relate to screening mammography.
Screening Mammography (9:24) http://www.youtube.com/watch?v=e3cG1xToqic
What does this study say about the value of diagnostic mammograms? What does it say about the value of screening mammograms? Can you generalize findings to all women or just subsets of women?
This website is maintained by the University of Maryland School of Nursing (UMSON) Office of Learning Technologies. The UMSON logo and all other contents of this website are the sole property of UMSON and may not be used for any purpose without prior written consent. Links to other websites do not constitute or imply an endorsement of those sites, their content, or their products and services. Please send comments, corrections, and link improvements to nrsonline@umaryland.edu.