Online Course
NRSG 795: BIOSTATISTICS FOR EVIDENCE-BASED PRACTICE
Module 8: Associations Between Nominal or Ordinal Variables
Measuring Disease
Rate, incidence, prevalence, risk, and hazard are indices of disease occurrence that are used in biostatistics. Although these indices appear simple, these terms have very specific meaning.
A rate is a type of ratio where two measurements are related to each other. In health care, rates commonly describe the occurrence of an event in a population. It may also be described in terms of time. For example, the number of events that occur in a defined period of time divided by the population at risk for that event during that period.
- Incidence describes the number of new cases or events during a prefixed period of time. It may be reported as a percent or per thousand at risk.
- Prevalence counts all existing cases at a point of time.
Incidence is the inflow and prevalence is the stock. Incidence rates are favored if the rapidity with which new disease is occurring in the population is of interest. A measure of prevalence is preferred if the focus is on the overall number of cases surviving in the population. [additional information]
Risk Indexes
Several descriptive statistical indexes can help facilitate decision making. Both absolute change (the actual amount of difference) and relative change (comparisons between groups) are important. Below is a table of indexes that can be generated from two dichotomous nominal level variables.
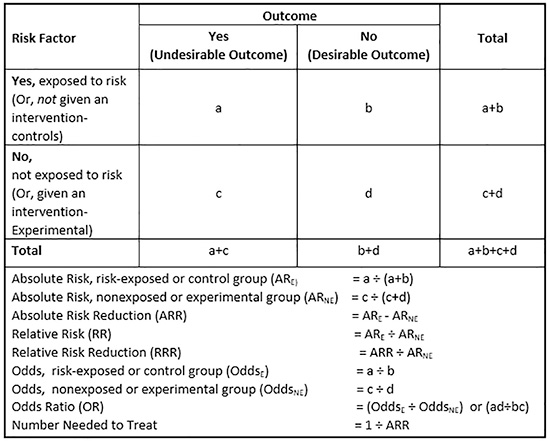
Risk should be restricted to prospective research for an outcome (e.g., risk of breast cancer) as it conveys more causal language; otherwise odds is generally used for an antecedent (e.g., odds of breast cancer when having the genetic marker versus not having it). These are often reported with indices such as relative risk and odds ratios [additional explanation]. The relative risk (RR) or risk ratio is the ratio of risk of an outcome such as disease in one group (say, the exposed group) to that in any other group (generally the control group - the unexposed group).
While the ideal way to determine the effect of a risk factor is through an experiment, this may be unethical. Prospective cohort studies may be used to observe the health effects of the exposed and unexposed but these take many years and be very costly. A RR is calculated in these circumstances. Alternatively, case control studies identify those with the disease and compare their risk factors to those without the disease. An odds ratio (OR) is calculated in these circumstances, as an estimate of the relative risk. It can be mathematically shown that an OR is approximately the same as RR when the prevalence of disease is low, say less than 5%. Relative risk and odds ratios can easily be calculated from 2x2 tables using a calculator. Since the dependent variable is having the disease (Yes/No), the odds of having the disease in one group is compared to the odds of another group. If multiple predictors (risk factors and covariates) need to be considered simultaneously, a logistic regression model can developed, following the same approach as in linear regression. However, now the dependent variable is nominal (Have disease/No disease), so normality assumptions are violated and linear regression cannot be used. Instead of beta coefficients, odds ratios are calculated for each predictor, representing the risk of the predictor relative to the outcome being studied.
How to Interpret Odds Ratios (OR)
The odds ratio takes values between zero ('0') and infinity. One ('1') is the neutral value and means that there is no difference between the groups compared; close to zero or infinity means a large difference. An odds ratio larger than one means that group one has a larger proportion than group two, if the opposite is true the odds ratio will be smaller than one. If you swap the two proportions, the odds ratio will take on its inverse (1/OR).
- Odds are fairly easy to visualize when they are greater than one, but are less easily grasped when the value is less than one. For an OR = 2.5 for smoking's effect on a cancer, we can say: Cancer is 2.5 times more likely to occur in smokers or we can say smoking might increase the odds of cancer 1.5 times (2.5-1=1.5). However, you need to be more careful with an OR of less than one.
- For ORs less than 1, all the above holds, except that all the words "increase" and "more" would be replaced with "decrease" and "less' etc., AND we would use the reciprocal of OR for our interpretation, instead (1/OR). For example, for an OR = 0.5 for a treatment of blood pressure, we should say "The likelihood of high blood pressure is twice (two as the reciprocal of 0.5) as less likely in the presence of the treatment", or we also can say "the odds of high blood pressure in the presence of this treatment is half the odds of the same disease without treatment (1-0.5)".
Required Readings and Videos
- Review Bonita, Beaglehole, and Kjellstrom pp. 15-23, 32-35, 46 (odds ratio)
https://iris.who.int/bitstream/handle/10665/43541/9241547073_eng.pdf?
sequence=1&isAllowed=y - Relationship between incidence and prevalence (3:39)
http://www.youtube.com/watch?v=1jzZe3ORdd8 - Odds ratio and relative risk calculation (8:12)
http://www.youtube.com/watch?v=xV0AwuDQJ1o - How to Interpret and Use a Relative Risk and an Odds Ratio (10:59)
http://www.youtube.com/watch?v=FZzm3-RRlI4 - NOT REQUIRED: article with more information
Learning Activity
This website is maintained by the University of Maryland School of Nursing (UMSON) Office of Learning Technologies. The UMSON logo and all other contents of this website are the sole property of UMSON and may not be used for any purpose without prior written consent. Links to other websites do not constitute or imply an endorsement of those sites, their content, or their products and services. Please send comments, corrections, and link improvements to nrsonline@umaryland.edu.