Online Course
NDNP 813 - DNP Project Evaluation and Dissemination
Module 4: DNP Project Manuscript
Results
The purpose of the results section of the DNP project manuscript is to only narrate your findings without trying to interpret or evaluate them in any way; that process belongs strictly in the discussion section.
Order of Results
The results section often follows the same chronological order as the plan for implementation. Every result included should have a method set out in the plan for implementation section. Conversely, every method should also have some results. See the following table as examples:
| Plan for Implementation Activities | Results |
|---|---|
| To train a projected number of health care practitioners on a change in practice. | Describe the number and characteristics of the staff who were trained |
| To review patient records for documentation of the practice change. | Describe the number and quality of practice changes documented |
| To survey health care practitioners on their attitudes toward the practice change. | Describe the results of the survey. |
| To evaluate the impact of the practice change on patient outcomes. | Describe the relationship between the practice change and patient outcomes. |
Statistical Information
If you have collected and analyzed quantitative data, take care to include information about the size and direction of any changes, including percentage change if appropriate. If you used a Run Chart to track the process overtime, include the mean as well as the upper and lower limits. Statistical tests should include details of p values or confidence intervals and limits.
Strengths and Negative Results
It is important to include any negative results - writing a results section without them not only invalidates the project, but is also poor scholarship. The negative results, and how the students handle them, often gives the makings of a great discussion section.
Text vs. Tables/Figures
Once your data is analyzed, the next step is to figure out how best to present your results: text, tables or figures. Summarize your results in the text, utilizing table and figures to illustrate the details or finer points. The text is also used to direct the reader to those findings in the table/figures, clarifying any unclear points. The tables and figure should be complementary with the text, but not repeat the same information. For example, see below a table that presented demographic data:
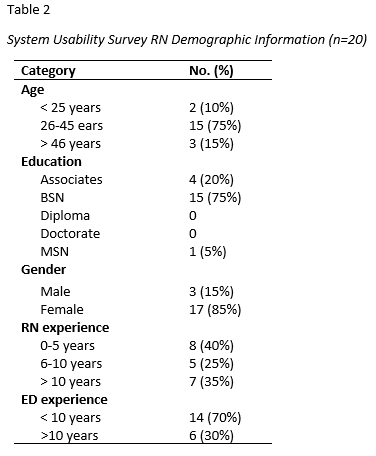
Here is how the student summarized the table in the text under the results section:
Descriptive statistics were calculated for the sample of nurses (n = 20) who completed the post-intervention SUS survey (see Table 2). The average age of the nurses ranged between 26-45 years, and 85% were female. The majority were BSN-prepared with less than ten years RN and ED experience.
This website is maintained by the University of Maryland School of Nursing (UMSON) Office of Learning Technologies. The UMSON logo and all other contents of this website are the sole property of UMSON and may not be used for any purpose without prior written consent. Links to other websites do not constitute or imply an endorsement of those sites, their content, or their products and services. Please send comments, corrections, and link improvements to nrsonline@umaryland.edu.