Online Course
NRSG 795: BIOSTATISTICS FOR EVIDENCE-BASED PRACTICE
Module 1: Variables, Values, and Spreadsheets as Databases
Datafiles and Programs to Run Statistics
First, why use Excel
Excel was selected since nearly all computers are equipped with a suite of programs that includes a spreadsheet program like Excel. There is a very high probability Excel is already on your computer so there is no cost to you for additional software needed for the course. The course focuses on a Windows/Intel system since that is the recommended operating system platform for the SON, however some help for Mac/Apple users is provided. Usually Mac/Apple users figure out the comparable commands and have no trouble following along in the course.
If you are familiar with other software (e.g., Lotus, SPSS, SAS, Stata), you can complete assignments using that software, however you are on your own to transfer the excel datasets into the other software and collegues in your study group may not be using this software so it makes it harder to share experiences of how to do things. SPSS is available on the student computers in the SON. The mechanics (e.g., which button to push) of how to perform the different statistical procedures is different for every software package, however, the fundamentals of why a particular test is chosen and what it is doing is constant regardless of the software. Furthermore, the writing up of the findings doesn’t depend on any particular software.
This course will provide materials on how to perform the procedures in Excel or IntellectusStatistics. In addition to the guides and videos posted, there are numerous other Excel resources available that you can turn to for help. While the analysis assignments encourage you to learn how to do things (which you can do as a group), keep in mind learning the why and what you are doing is just a little more important than the how to do it. Previous students have indicated the analysis exercises help reinforce their understanding of what the statistical test is about because they have to apply it and not just read about it.
Data organization
There are several ways to organize data. Spreadsheets are perfect for data that can be easily plotted, for example tracking daily/monthly outcomes over the course of a year. If only a few rows and columns are needed, the data is best stored in a spreadsheet. Spreadsheets are meant to handle lots of the same type of data, mapping the progress of a few key points. The data is simple to use and Spreadsheets are great for one-time events that do not require the tracking of many different aspects. For projects that need one or two charts or tables for a presentation, a spreadsheet is the best way to go.
On the other hand, if one has a lot of different types of data that all have some relationship to the other data then data is best organized in a database. Databases have a relational data structure and are designed to make it easy for users to generate reports and run queries. In a database, some parts of the data will remain the same, such as patient identification information, while the number of orders and timeliness of mediation administration, etc are actions that can be tracked. Actions have many different components to them, and trying to track them all requires a database. Databases are for longer projects where data is likely to be used again and again.
Spreadsheets are commonly used to summarize data, answer “what-if” questions, and make figures. Most of the statistics used to answer these kinds of questions involve basic computations (e.g., adding, dividing, multiplying, counting). In this class, these computations will be used to compute descriptive statistics such as means and frequencies (summations about the people or objects that you have actually measured). However, Excel also can be used to do basic inferential statistics such as t-test, ANOVA, Chi-square, and regression (i.e., using data from a sample to infer the properties/parameters of a population).
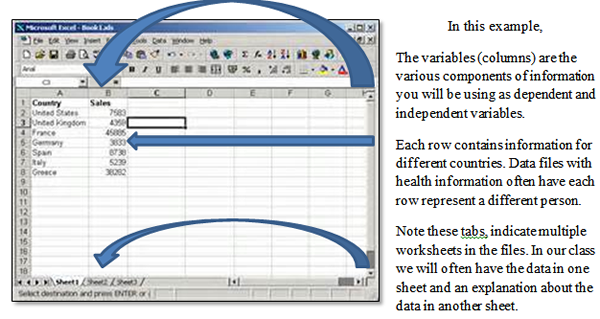
This course will be using data that is captured on an Excel spreadsheet where the rows are usually observations (unique patients) and the columns are the variables (characteristic that has different values for different people). Each Excel “worksheet” can be thought of as a database file. Multiple worksheets can be packaged together as a “workbook” (note the multiple sheets at the bottom).
Required Reading/Videos
- Not required for this course but may be handy in the future:
How to create data entry in Excel
https://www.youtube.com/watch?v=mmsplzGsvJ0 (4:19)
Activity
- Make a decision on what software you will use
- This is a link to a free version of Intellectus Statistics so you can see what it is like to help you make your decision. Attention: this trial version does not provide you access to all the features you will need for the course. https://www.intellectusstatistics.com/intellectus-free/
- Here is a video that shows you the various things this software can do (3:52)
https://www.youtube.com/channel/UCoQMR3Dk__WbI2MEUk_A30A - Gain access to the software you are choosing (see table below for instructions) and make sure it is working
| Guide for those choosing to use IntellectusStatistics |
Guide for those choosing to use Excel |
|---|---|
| The excel features already on your computer will be sufficient to look at the data. You do not need to install the Excel analysis tool pack. A feature in the new software easily allows you to import Excel datafiles. |
If you are choosing to use Excel for this course you will need to install the analysis tool pack using the guide below. Use this week to start familiarizing yourself with Excel and how to do basic functions. |
| Intellectus Statistics is a cloud-based statistical application that facilitates the designing, conducting, and interpreting of analyses. It is user-friendly and guides students through the analyses process with helpful features such as scroll-over definitions to assist with your understanding along the way, pre-loaded assumptions, and providing the output of your analysis in English prose. There is also a decision tree to help you select the appropriate analysis to examine your research questions, sample-size calculator, and data analysis plan templates included. | Excel 2016 (and older versions) have free add-ins that must be activated in order to do the statistics we will learn about. These add-ins are often not active in most versions of Excel. So you may need to install them. They are required for this class. Excel 16 users: The Excel basic tutorial illustrates how to load the data analysis “add-ins” (analysis tool pack and Solver) and introduces you to some Excel basics: Excel basics tutorial https://www.youtube.com/watch?v=rwbho0CgEAE (21:46) |
| Connecting to the Intellectus software | Installing Analysis tool pack |
Below is a link that will allow students to purchase 6-months of access/subscription for $60. Purchase Here: This is a purchase link only, and after purchase, please login from the main link: To get started please see the helpful links below: Video Tutorials - There's over 50 video tutorials to assist with conducting analyses and other functions. Weekly Training Session - This is open to students and faculty and held every Tuesday at 1pm ET, which is a general overview of the program and open up questions" |
1. Click the Ribbon’s file tab and choose Options 2. Choose Add-Ins from the Options navigation bar. 3. At the bottom of the View and Manage Add-Ins window, make sure that the Manage drop –down is set to Excel Add-Ins, then click GO. 4. An Add-Ins dialog box should appear. Look for Analysis tool pack, fill in its check box and click OK. 5. You should now find the Analysis group on the Ribbon’s data tab |
| Attention Mac users: Excel for Mac 2016 includes the Solver and Data Analysis add-in built-in. 1. Open Excel for Mac 2016 and Go to the Tools menu, select "Add-ins" 2. Check "Solver Add-in" and "Analysis ToolPak" then click OK 3. Select the "Data" tab, then select "Solver" or "Data Analysis". |
|
| Video of how to install tool pack if older version of Excel https://www.youtube.com/watch?v=mtmrAXwLcuU |
This website is maintained by the University of Maryland School of Nursing (UMSON) Office of Learning Technologies. The UMSON logo and all other contents of this website are the sole property of UMSON and may not be used for any purpose without prior written consent. Links to other websites do not constitute or imply an endorsement of those sites, their content, or their products and services. Please send comments, corrections, and link improvements to nrsonline@umaryland.edu.