Online Course
NRSG 780 - Health Promotion and Population Health
Module 3: Epidemiology
Descriptive Epidemiology
There are three types of epidemiological studies:
- Descriptive epidemiology
- Analytical epidemiology
- Experimental epidemiology
Descriptive epidemiology focuses on morbidity and mortality data.
Measures of Mortality and Morbidity
In order to critically review the scientific and clinical literature, it is essential to understand the definitions and be able to distinguish among the various measures of morbidity and mortality:
- numbers of deaths
- crude mortality rates
- age-specific mortality rates
- age-adjusted mortality rates
- years of life lost
- incidence rates
- prevalence
- attack rates
- case fatality rates
Measures of morbidity and mortality are generally expressed as a multiple of 10.
Measures of Mortality
The crude mortality rate expresses the actual observed mortality rate in a population under study.
![]()
Crude mortality rates do not take into account the cause of mortality or the age, ethnicity or sex of the population. Crude mortality rates should always be the starting point for further development of adjusted rates.
Cause-specific mortality rate identifies the number of deaths from a particular condition during a calendar year in the population under study.
![]()
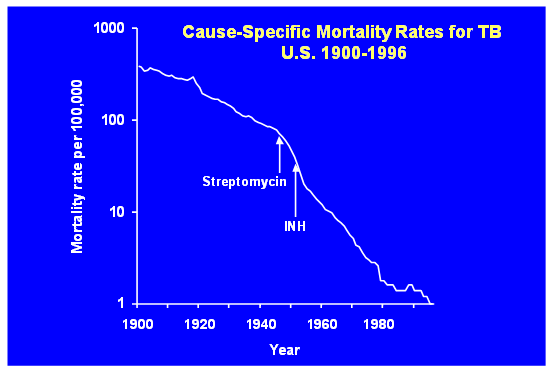
If we study cause specific mortality from TB, this graph shows the dramatic decline in rates over the past century.
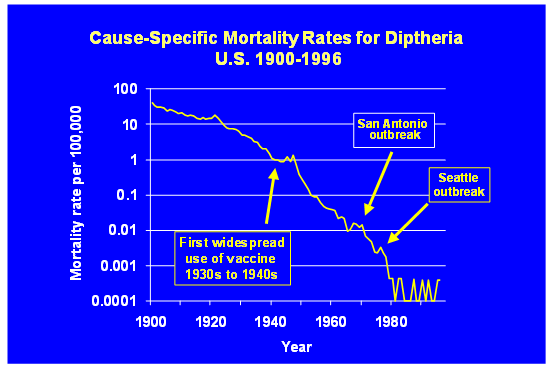
This graph shows the similar decline in cause-specific mortality from diphtheria
Age-specific mortality rates focus on a particular age range, e.g., 20-29 years.
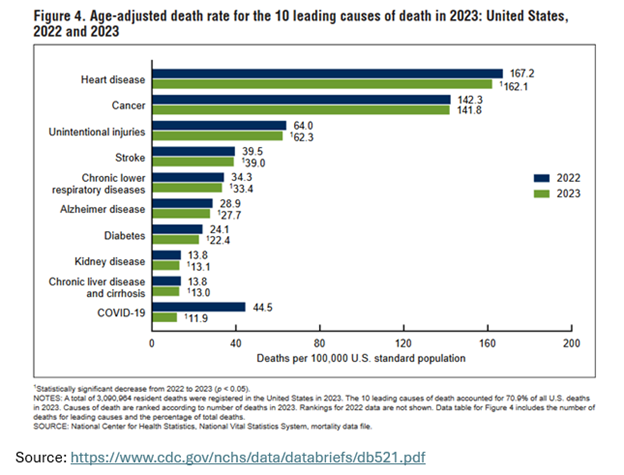
Age-adjusted mortality rates are calculated by applying age specific rates to the age-distribution of the population at a particular point in time, usually either 1940, 1970 or 2000. These rates allow comparison of rates among communities, states or countries with populations of different age distributions, for example Japan and India. They also allow comparisons of morality rates over time within communities, states or countries as age distribution changes over time.
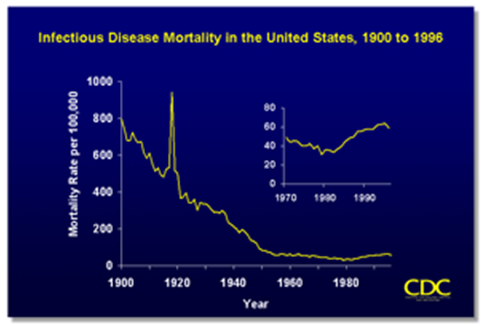
Knowing that the average longevity of the population at the beginning of the century was 47 and the current expected life span is near 75, by age-adjusting, it is possible to see the impact of health problems over time. This chart shows that there has been a tremendous decline in infectious diseases during the 20th century. The single exception was the effect of the influenza pandemic in the early part of the century.
Now in the 21st century we are experiencing declines in life expectancy that reflect increases in mortality from heart disease, cancer, substance use, and COVID-19.
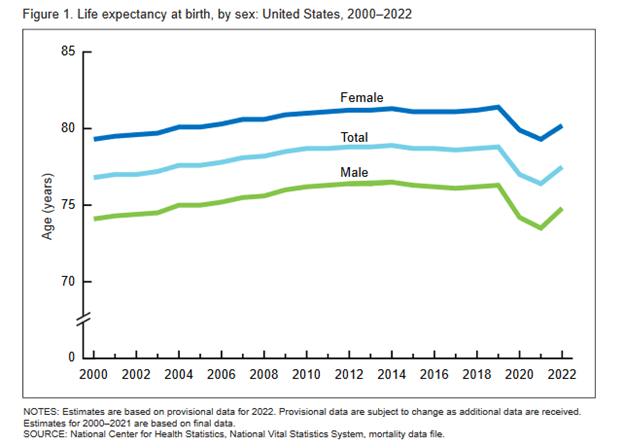
Source: https://www.cdc.gov/nchs/data/vsrr/vsrr031.pdf
Source: NCHS Data Brief No. 456, December 2022
Years of life lost are a measure of the impact to society of deaths from various causes. Rather than looking at the pure number of deaths, the age at which death occurs is the focus. The number of premature deaths, usually considered as death before age 75, are aggregated and then the toll on society from specific disease categories is calculated. This measure reflects the years lost to society, in terms of work productivity, family life and contributions to society as a whole.
Years of life lost were initially calculated based on the average of retirement—65, but now they are more typically calculated based on 75 or 85. The older we get, the more inclined we are to consider years of life lost as the sum total before 75, 85 or greater.
Measures of Morbidity
Incidence measures the number of new cases of a disease over the population at risk during a time frame, usually a year.
![]()
Such a rate is calculated for a specific period of time (usually one year) for a particular geographic area. The rate is usually presented as the number of cases per 1000, or 100,000, or 1,000,000 population.
For example, there were 500 new cases of cancer per 100,000 population in Maryland in 2010.
Prevalence measures of all cases that exist within the population at risk. The onset of the disease is not a factor. It represents the number of people with a particular disease or condition in a geographic area.
Prevalence represents the number of people with a particular disease or condition in a specific area per 100 or 1000, or 100,000, or 1,000,000 population.Prevalence is generally measured either at a point in time (“point prevalence”) or over a period of time (“period prevalence”).
For example, there were approximately 2400 people per 100,000 population with coronary heart disease in the United States in 2010. Note that because prevalence does not measure new cases developing over time, it does not represent a rate, but rather a proportion.
Relationship between Incidence and Prevalence
There is a relationship between incidence and prevalence.
prevalence = incidence X duration
If you know two of the three parameters, you can calculate the third.
A change in disease prevalence may be due either to an increase in incidence or to an increase in the average length of time between disease onset and resolution (or death).
For infectious diseases, incidence rates are generally more useful than prevalence. In contrast, for chronic diseases and conditions, prevalence may be more useful (e.g., for hypertension).
Attack Rates are often calculated for outbreaks of infectious diseases having a very rapid onset. They are similar to incidence rates, except it does not include the dimension of time.
![]()
Attack rates are often calculated for outbreaks of foodborne illness, usually at picnics or special events: the number of people who ate the food and became sick divided by the number who ate the food.
![]()
Case Fatality Rates usually are calculated for outbreaks of infectious diseases. They reflect the number of people who died from the disease over the number who contracted the disease. Such rates were calculated for Legionnaires Disease and for the deaths due to Anthrax following 9/11.
![]()
Exercise:
- 1200 students out of 1500 in the School of Nursing currently are habitually physically inactive.
- What is that measure called?
- Calculate the measure.
- Six out of those 1500 students develop meningitis in the next year.
- What is that measure called?
- Calculate the measure.
- Two of those six students die.
- What rate would you calculate?
- Calculate the measure.
- You wish to compare rates of death for UMB’s nursing and social work students.
- What rates should you first calculate?
- You wish to compare death rates for male and female faculty members at UMB.
- What rates should you calculate?
- You wish to compare rates of death from cancer for two countries.
- What rates should you calculate?
Click here for answers to the exercise.
This website is maintained by the University of Maryland School of Nursing (UMSON) Office of Learning Technologies. The UMSON logo and all other contents of this website are the sole property of UMSON and may not be used for any purpose without prior written consent. Links to other websites do not constitute or imply an endorsement of those sites, their content, or their products and services. Please send comments, corrections, and link improvements to nrsonline@umaryland.edu.