Online Course
NRSG 780 - Health Promotion and Population Health
Module 5: Health Disparities / Cultural Competence
Examples of Health Disparities
All disparities are not inequities consider the following:
Disability Measures
Basic actions difficulty and complex activity limitation are ways of measuring disability status:
- Basic actions difficulty measures limitations in movement, and emotional, sensory, or cognitive functioning associated with a health problem.
- Complex activity limitation is the inability to function successfully in certain social roles, such as working, maintaining a household, living independently, or participating in community activities.
As shown in the image below from 2000 to 2010, the prevalence of each disability was higher for women than men in the same age group, with the exception of complex activity limitation among those aged 18–64, where the prevalence was the same for men and women.
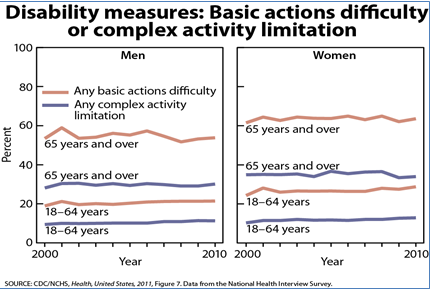
Differences between men and women, young and old are disparities, but they are not inequities.
Obesity in Children
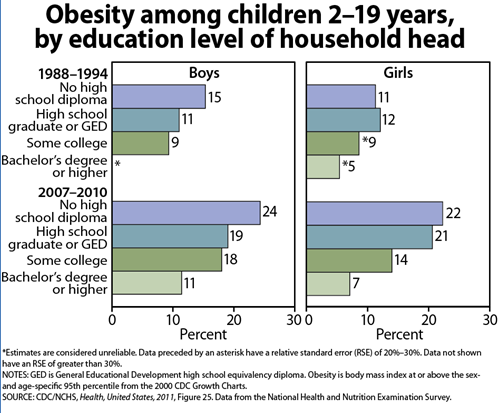
Some health disparities appear to be decreasing over time in the United States. For example, from 1988 to 1994 higher levels of education among the head of household resulted in lower rates of obesity among boys and girls 2-19 years of age. This trend continued in surveys from 2007-2010 but the rates of obesity increased in all groups. In households where the head of household had less than a high school education, 24% of boys and 22% of girls were obese. In households where the head had a bachelor’s degree or higher, obesity prevalence was 11% for males and 7% for females aged 2-19. In the case of obesity, rates for all groups are increasing even though disparities among groups are decreasing. It is important to recognize that decreasing disparities alone is not sufficient but that we need to make sure that health status is improving as well.
Life Expectancy
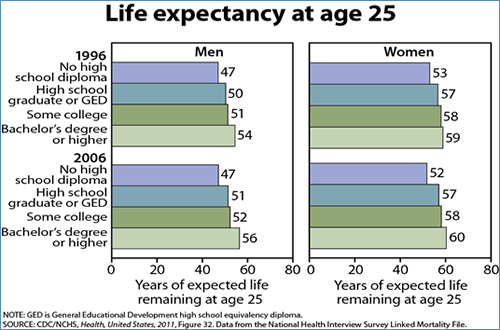
Another example of a health disparity is the widening of the gap in life expectancy at age 25 between 1996 and 2006 for both men and women. Between 1996 and 2006, life expectancy increased for men and women with a Bachelor’s degree or higher, while remaining unchanged for those with less than a Bachelor’s degree. The high school graduation rate in the U.S. is 75%. Consider the impact of increasing the rate on the health status of the US.
Delay or Nonreceipt of Medical Care or Prescription Drugs Due to Cost
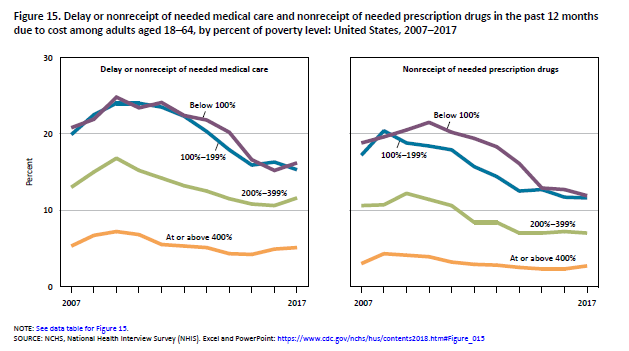
Health disparity is also noted in the delay or nonreceipt of medical care or prescription drugs. These kinds of delays may result in more serious illness, increased complications, and longer hospital stays. From 2007 to 2017, adults with lower incomes were more likely to delay or not receive needed medical care due to costs than those with higher incomes. Similarly, adults with lower incomes were more likely to forgo needed prescriptions drugs due to costs than those with higher incomes.
SOURCE: CDC/NCHS, Health,UnitedStates, 2018. Data from the National Health Interview Survey (NHIS).
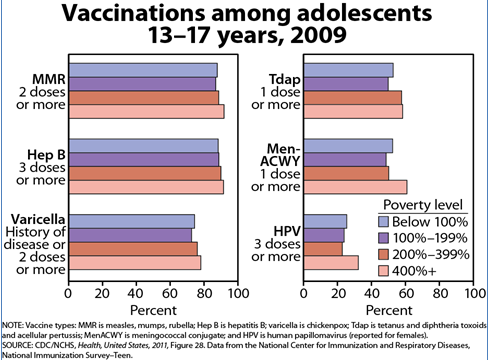
Vaccinations
One area in which there has been great success in reducing health disparities is in vaccinations among adolescents. Vaccinations recommended for the preteen to the teenage years include tetanus and diphtheria toxoids and acellular pertussis vaccine (Tdap), meningococcal conjugate vaccine (MenACWY), and three doses of human papillomavirus vaccine (HPV). MenACWY was recommended for use in 2011 and HPV for females in 2007. Although adolescents living in poverty were less likely to have recommended vaccinations compared with adolescents living in families with income at 400% or more of the poverty level, the differences were relatively low. Vaccinations may be expensive but are often covered by health insurance. Uninsured children may receive vaccinations at little or no cost. In addition, many schools, daycare, camps and other facilities require proof of vaccination before children can participate. We need to recognize these programs as a model on how to counter health disparities.
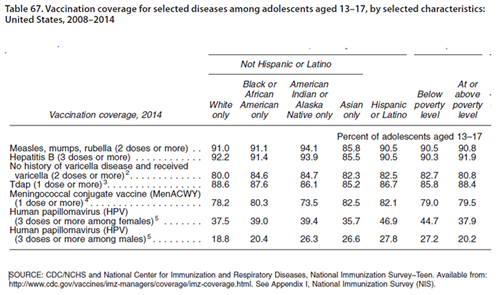
Vaccine coverage has further improved over the last five years and differences based on poverty level have been eliminated as noted in the table below.
This website is maintained by the University of Maryland School of Nursing (UMSON) Office of Learning Technologies. The UMSON logo and all other contents of this website are the sole property of UMSON and may not be used for any purpose without prior written consent. Links to other websites do not constitute or imply an endorsement of those sites, their content, or their products and services. Please send comments, corrections, and link improvements to nrsonline@umaryland.edu.